Accessing Lawncare Reports
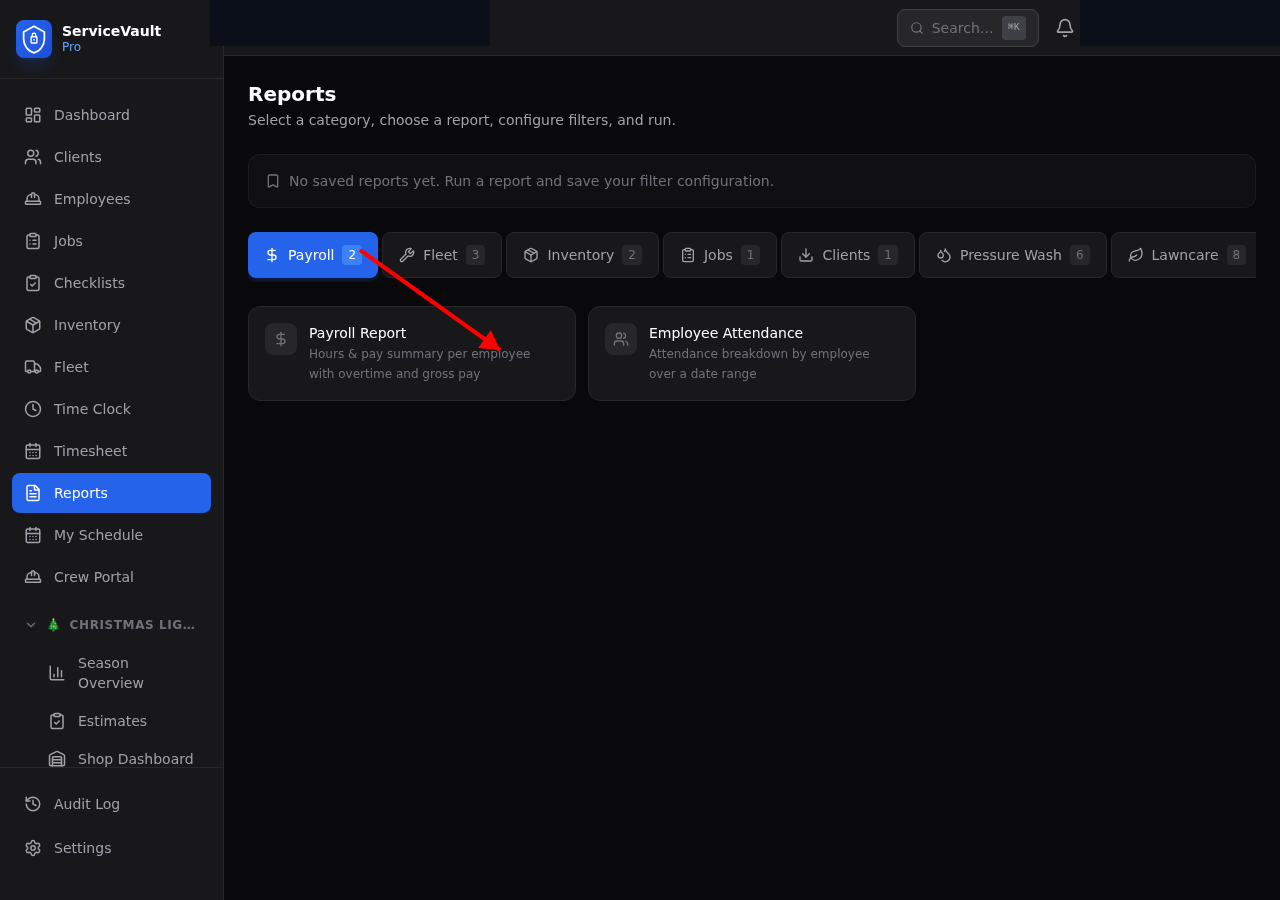
Go to Reports in the sidebar and click the Lawncare tab. You'll see 8 report cards.
Available Reports
- Revenue per Client — Shows weekly, monthly, and annual revenue for each client based on their recurring cut price. Filter by date range to see actual completed visits.
- Revenue per Route — Which routes generate the most revenue? Shows stop count and average revenue per stop to identify your most efficient routes.
- Cost per Property — Combines labor cost (crew time x rate), chemical cost (from application logs), and compares to revenue for each property. Shows profit margin per client.
- Chemical Usage by Product — How much of each product you've applied, total cost, and number of applications. Use this for purchasing decisions and inventory planning.
- Fertilizer Completion Rate — By program, shows how many enrolled clients completed all rounds vs. dropped off. Track program success rate by season.
- Crew Productivity — Properties completed per crew member, total minutes, and average time per property. Identify your top performers and training opportunities.
- Skipped Cuts — Breaks down skips by reason (rain, cancellation, no access, etc.) with estimated revenue lost. Know where you're losing money.
- Equipment Cost per Hour — Maintenance cost divided by engine hours for each piece of equipment. Identify which mowers are money pits before they break down on a job.
Running a Report
- Click the report card
- Set your date range filters
- Click Run Report
- Review the summary cards and detailed table
- Click CSV to export for Excel or accounting